An end-to-end analytics project that turns 3,900 retail purchases into clear insights on spending, loyalty and subscriptions. I cleaned the data in Python, analyzed it with ten SQL queries in MySQL, and built an interactive Power BI dashboard to explore the results.
Tools: Python (Pandas), MySQL, Power BI | View the project on GitHub
- 3,900 purchases analyzed
- 18 columns of customer data
- 10 business questions answered
The Scenario
A retail company wants to understand how its customers shop so it can improve sales, customer satisfaction and long-term loyalty. Purchasing patterns have shifted across demographics, product categories and sales channels, and management wants to know what drives those decisions. The question this project answers:
How can the company use consumer shopping data to identify trends, improve customer engagement and optimize its marketing and product strategies?
How the Project Works
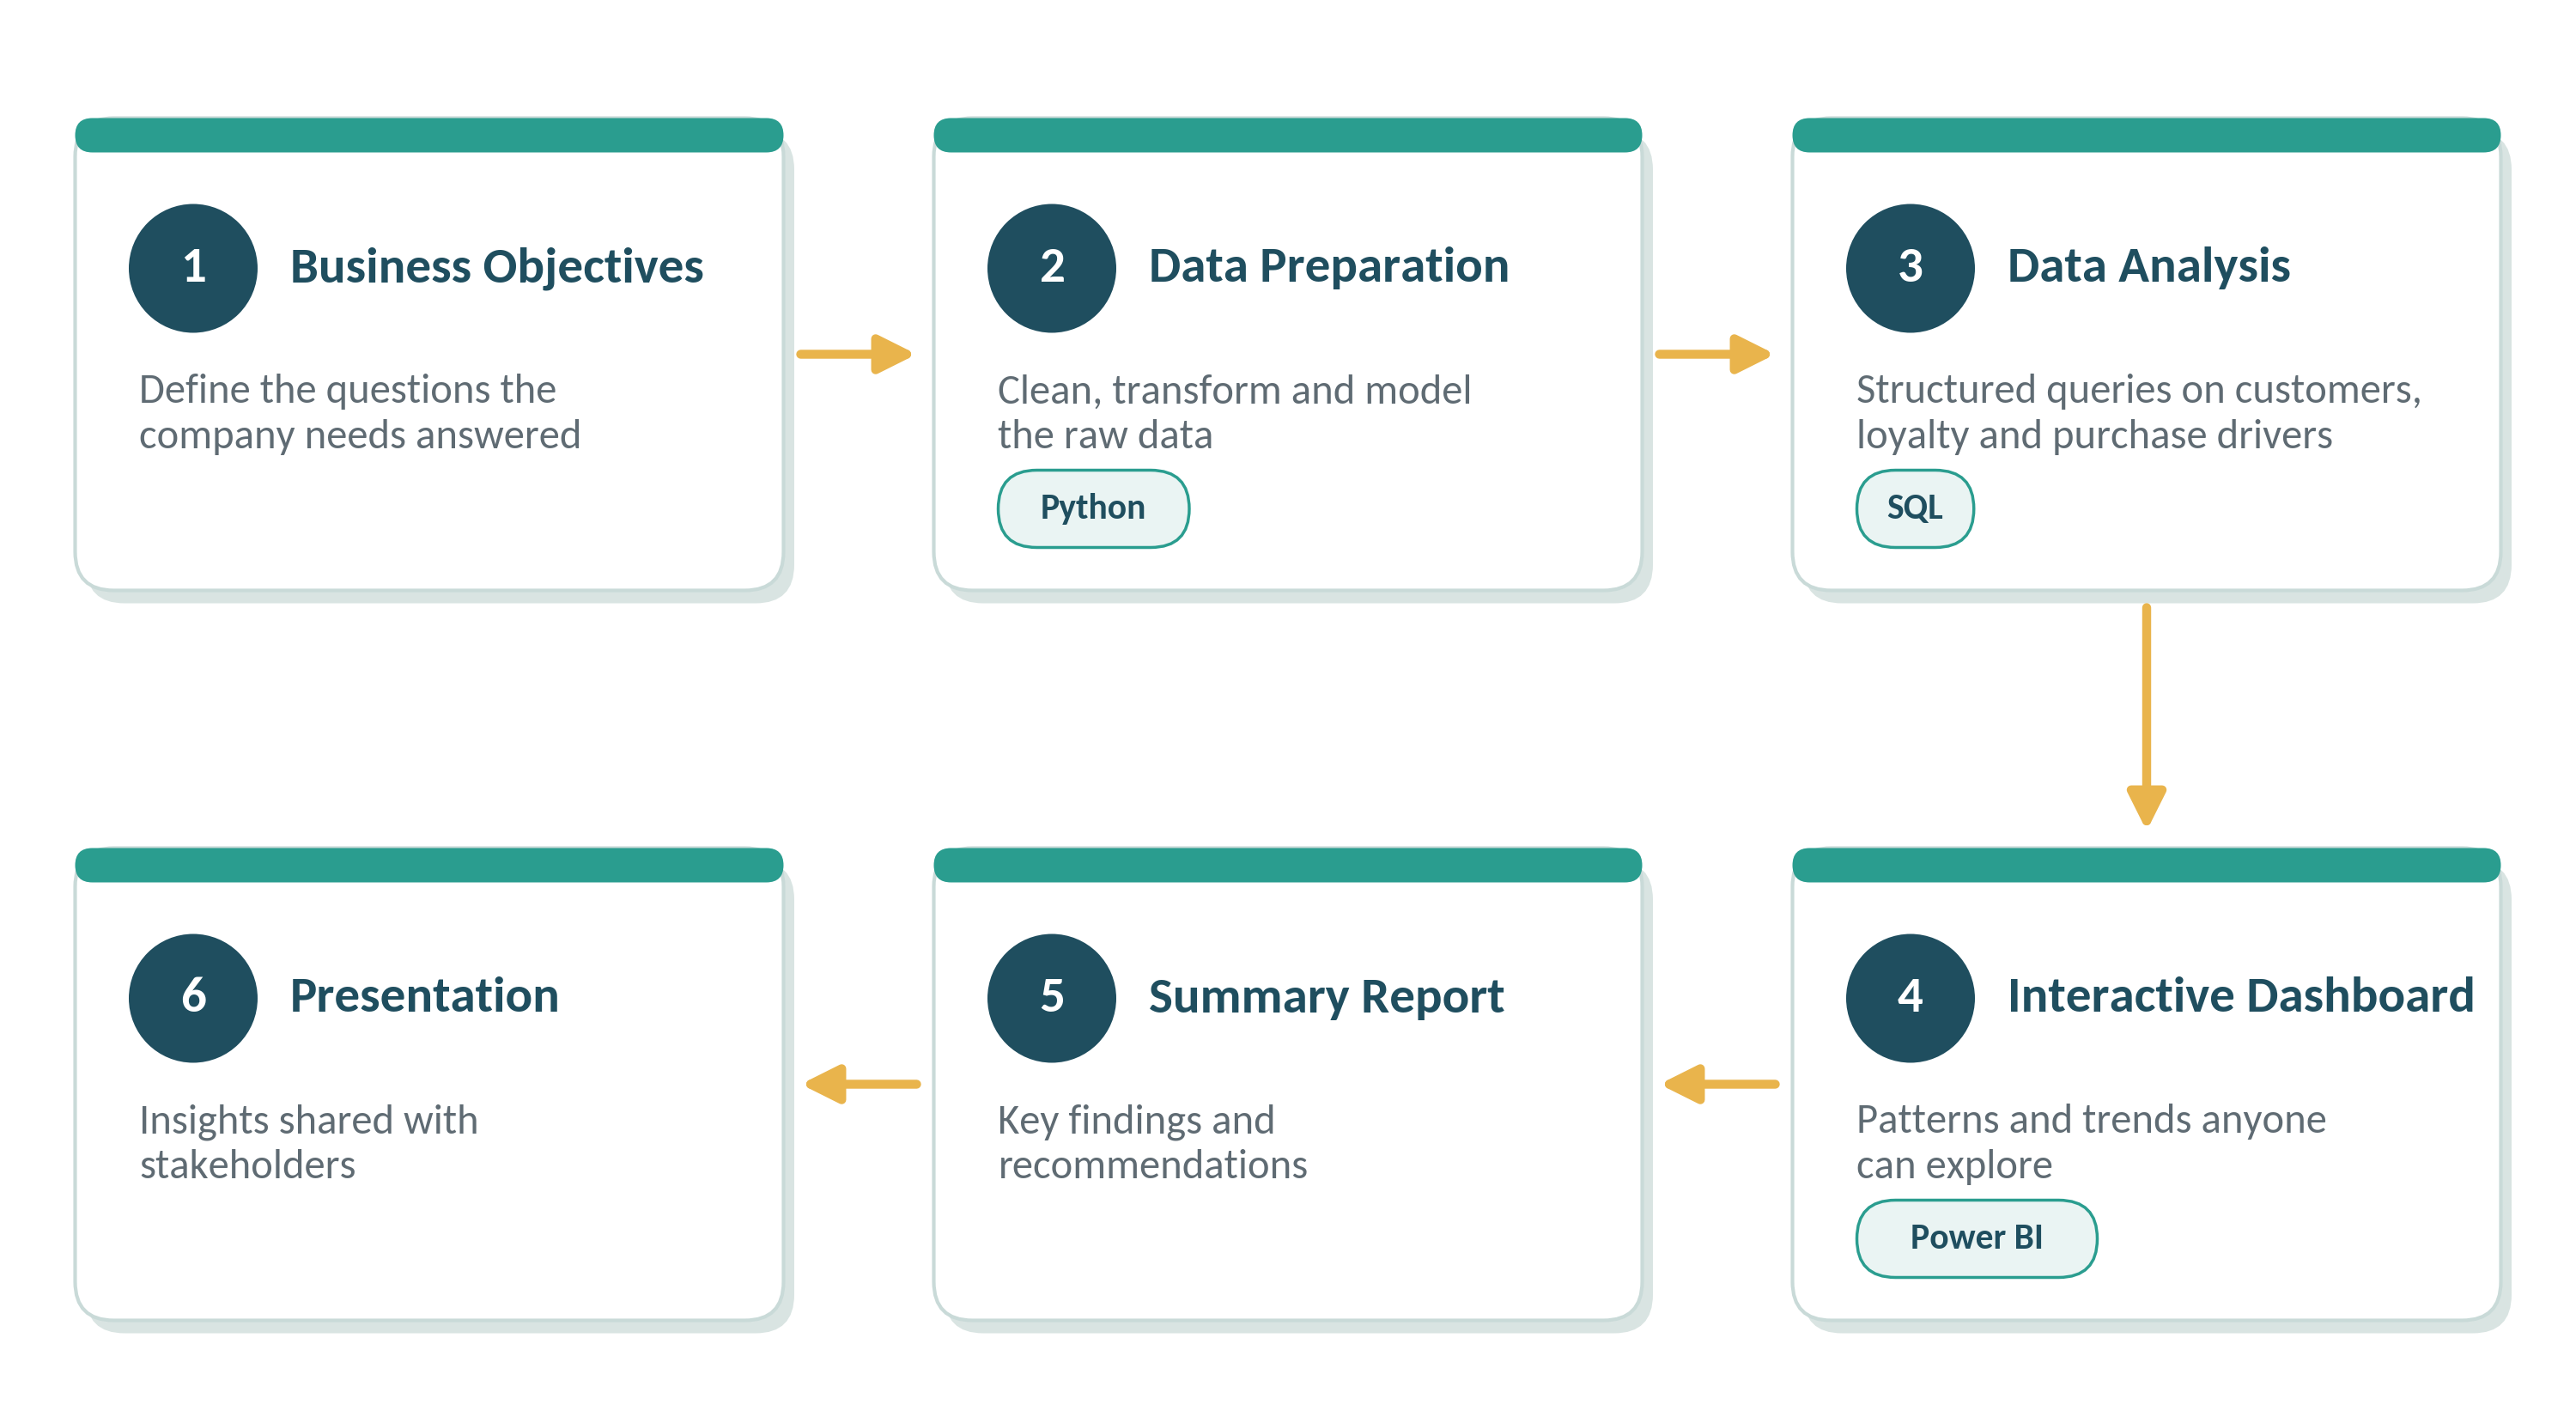
The project follows six connected steps, taking the data from raw records to clear, actionable insights.
Data Preparation in Python
The raw file had 18 columns and 37 missing review ratings. I used Pandas to clean and prepare it, then loaded the result into MySQL for analysis. Here is what I ran, step by step. Click “Show the output” to see the result of each step.
Step 1: Load and Inspect the Data
The output confirms 3,900 rows and 18 columns, and shows that Review Rating holds only 3,863 values, so 37 are missing.
import pandas as pd df = pd.read_csv('customer_shopping_behavior.csv') df.info()Show the output
<class 'pandas.core.frame.DataFrame'> RangeIndex: 3900 entries, 0 to 3899 Data columns (total 18 columns): # Column Non-Null Count Dtype --- ------ -------------- ----- 0 Customer ID 3900 non-null int64 1 Age 3900 non-null int64 2 Gender 3900 non-null object 3 Item Purchased 3900 non-null object 4 Category 3900 non-null object 5 Purchase Amount (USD) 3900 non-null int64 6 Location 3900 non-null object 7 Size 3900 non-null object 8 Color 3900 non-null object 9 Season 3900 non-null object 10 Review Rating 3863 non-null float64 11 Subscription Status 3900 non-null object 12 Shipping Type 3900 non-null object 13 Discount Applied 3900 non-null object 14 Promo Code Used 3900 non-null object 15 Previous Purchases 3900 non-null int64 16 Payment Method 3900 non-null object 17 Frequency of Purchases 3900 non-null object dtypes: float64(1), int64(4), object(13) memory usage: 548.6+ KBStep 2: Find and Fill Missing Values
Rather than using one overall median, each missing rating is filled with the median rating of its own product category. This keeps each group’s ratings realistic. Missing Review Ratings: 37 → 0.
# Fill missing ratings with the median rating of each product category df['Review Rating'] = df.groupby('Category')['Review Rating'].transform( lambda x: x.fillna(x.median()) )Show the check before and after
Before
df.isnull().sum() Customer ID 0 Age 0 Gender 0 Item Purchased 0 Category 0 Purchase Amount (USD) 0 Location 0 Size 0 Color 0 Season 0 Review Rating 37 Subscription Status 0 Shipping Type 0 Discount Applied 0 Promo Code Used 0 Previous Purchases 0 Payment Method 0 Frequency of Purchases 0 dtype: int64After
df.isnull().sum() Customer ID 0 Age 0 Gender 0 Item Purchased 0 Category 0 Purchase Amount (USD) 0 Location 0 Size 0 Color 0 Season 0 Review Rating 0 Subscription Status 0 Shipping Type 0 Discount Applied 0 Promo Code Used 0 Previous Purchases 0 Payment Method 0 Frequency of Purchases 0 dtype: int64Step 3: Standardize the Column Names
Mixed upper and lower case and spaces make analysis in Python and SQL error-prone, so every name is converted to lower snake case.
df.columns = df.columns.str.lower() df.columns = df.columns.str.replace(' ', '_') df = df.rename(columns={'purchase_amount_(usd)': 'purchase_amount'})Show the column names before and after
Before
Customer ID Age Gender Item Purchased Category Purchase Amount (USD) Location Size Color Season Review Rating Subscription Status Shipping Type Discount Applied Promo Code Used Previous Purchases Payment Method Frequency of PurchasesAfter
customer_id age gender item_purchased category purchase_amount location size color season review_rating subscription_status shipping_type discount_applied promo_code_used previous_purchases payment_method frequency_of_purchasesStep 4: Create New Columns
Age groups: ages are split into four quartile-based groups, so each group holds roughly a quarter of the customers rather than a fixed age range.
labels = ['Young Adults', 'Adults', 'Middle-aged', 'Seniors'] df['age_group'] = pd.qcut(df['age'], q=4, labels=labels) df[['age', 'age_group']].head(10)Show the output
age age_group 0 55 Middle-aged 1 19 Young Adults 2 50 Middle-aged 3 21 Young Adults 4 45 Middle-aged 5 46 Middle-aged 6 63 Seniors 7 27 Young Adults 8 26 Young Adults 9 57 Middle-agedPurchase frequency in days: the text purchase frequency becomes a number of days, which is much easier to analyze.
frequency_mapping = { 'Fortnightly': 14, 'Weekly': 7, 'Monthly': 30, 'Quarterly': 90, 'Bi-Weekly': 14, 'Annually': 365, 'Every 3 Months': 90 } df['purchase_frequency_days'] = df['frequency_of_purchases'].map(frequency_mapping) df[['purchase_frequency_days', 'frequency_of_purchases']].head(10)Show the output
purchase_frequency_days frequency_of_purchases 0 14 Fortnightly 1 14 Fortnightly 2 7 Weekly 3 7 Weekly 4 365 Annually 5 7 Weekly 6 90 Quarterly 7 7 Weekly 8 365 Annually 9 90 QuarterlyStep 5: Remove a Duplicate Column
The discount_applied and promo_code_used columns looked identical. A direct comparison confirmed they match on every row (the result is True), so I kept one and dropped the other.
# Are the two columns identical? (df['discount_applied'] == df['promo_code_used']).all()Truedf = df.drop('promo_code_used', axis=1) df.columnsShow the output
Index(['customer_id', 'age', 'gender', 'item_purchased', 'category', 'purchase_amount', 'location', 'size', 'color', 'season', 'review_rating', 'subscription_status', 'shipping_type', 'discount_applied', 'previous_purchases', 'payment_method', 'frequency_of_purchases', 'age_group', 'purchase_frequency_days'], dtype='object')Step 6: Check the Cleaned Data
Summary statistics on the cleaned table show an average purchase of about $59.76 and an average review rating of 3.75, the same headline figures that appear on the dashboard.
df.describe()Show the summary statistics
customer_id age purchase_amount review_rating \ count 3900.000000 3900.000000 3900.000000 3900.000000 mean 1950.500000 44.068462 59.764359 3.750051 std 1125.977353 15.207589 23.685392 0.713590 min 1.000000 18.000000 20.000000 2.500000 25% 975.750000 31.000000 39.000000 3.100000 50% 1950.500000 44.000000 60.000000 3.800000 75% 2925.250000 57.000000 81.000000 4.400000 max 3900.000000 70.000000 100.000000 5.000000 previous_purchases purchase_frequency_days count 3900.000000 3900.000000 mean 25.351538 89.133077 std 14.447125 119.037566 min 1.000000 7.000000 25% 13.000000 14.000000 50% 25.000000 30.000000 75% 38.000000 90.000000 max 50.000000 365.000000Step 7: Load the Data Into MySQL
The cleaned table is loaded into MySQL for the SQL analysis. The connection asks for the password at the prompt, so it is never stored in the code. All 3,900 rows loaded successfully.
from getpass import getpass from sqlalchemy import create_engine from sqlalchemy.engine import URL url = URL.create( "mysql+pymysql", username="root", password=getpass("MySQL password: "), host="localhost", port=3306, database="customer_behavior", ) engine = create_engine(url) df.to_sql("customer_shopping_behavior", con=engine, if_exists="replace", index=False)The Full Script
The same steps are also available as one runnable Python script. You can also open the full notebook on GitHub.
View the full script
""" Customer Shopping Behavior: Data Preparation Cleans the raw customer shopping dataset and (optionally) loads it into MySQL for SQL analysis. Usage ----- python customer_behavior_prep.py --csv customer_shopping_behavior.csv --skip-db python customer_behavior_prep.py --csv customer_shopping_behavior.csv The MySQL password is requested at the prompt and is never stored in the code. """ import argparse import os from getpass import getpass import pandas as pd FREQUENCY_DAYS = { "Weekly": 7, "Fortnightly": 14, "Bi-Weekly": 14, "Monthly": 30, "Quarterly": 90, "Every 3 Months": 90, "Annually": 365, } # Quartile-based groups, so each group holds roughly a quarter of the customers. AGE_LABELS = ["Young Adults", "Adults", "Middle-aged", "Seniors"] def load_data(path: str) -> pd.DataFrame: """Read the raw CSV file.""" return pd.read_csv(path) def fill_missing_ratings(df: pd.DataFrame) -> pd.DataFrame: """Fill missing review ratings with the median rating of each product category.""" df["Review Rating"] = df.groupby("Category")["Review Rating"].transform( lambda x: x.fillna(x.median()) ) return df def standardize_columns(df: pd.DataFrame) -> pd.DataFrame: """Make column names lower snake case so they are safe to use in Python and SQL.""" df.columns = df.columns.str.lower().str.replace(" ", "_") return df.rename(columns={"purchase_amount_(usd)": "purchase_amount"}) def add_age_group(df: pd.DataFrame) -> pd.DataFrame: """Bin customer ages into four quartile-based groups.""" df["age_group"] = pd.qcut(df["age"], q=4, labels=AGE_LABELS) return df def add_purchase_frequency_days(df: pd.DataFrame) -> pd.DataFrame: """Turn the text purchase frequency into a number of days.""" df["purchase_frequency_days"] = df["frequency_of_purchases"].map(FREQUENCY_DAYS) return df def drop_duplicate_discount_column(df: pd.DataFrame) -> pd.DataFrame: """Drop promo_code_used when it is identical to discount_applied.""" if (df["discount_applied"] == df["promo_code_used"]).all(): df = df.drop(columns="promo_code_used") else: print("promo_code_used differs from discount_applied, so it was kept.") return df def prepare(df: pd.DataFrame) -> pd.DataFrame: """Run every cleaning and feature engineering step in order.""" df = fill_missing_ratings(df) df = standardize_columns(df) df = add_age_group(df) df = add_purchase_frequency_days(df) return drop_duplicate_discount_column(df) def load_to_mysql(df: pd.DataFrame, host: str, port: int, user: str, database: str, table: str) -> None: """Load the cleaned data frame into a MySQL table.""" from sqlalchemy import create_engine from sqlalchemy.engine import URL url = URL.create( "mysql+pymysql", username=user, password=getpass("MySQL password: "), host=host, port=port, database=database, ) engine = create_engine(url) with engine.connect(): print("Connected") rows = df.to_sql(table, con=engine, if_exists="replace", index=False) print(f"Loaded {rows} rows into {database}.{table}") def main() -> None: parser = argparse.ArgumentParser(description=__doc__.split("\n\n")[1]) parser.add_argument("--csv", default="customer_shopping_behavior.csv") parser.add_argument("--skip-db", action="store_true", help="Only clean the data and save a CSV; do not load MySQL.") parser.add_argument("--out", default="customer_shopping_behavior_clean.csv") parser.add_argument("--host", default="localhost") parser.add_argument("--port", type=int, default=3306) parser.add_argument("--user", default=os.environ.get("DB_USER", "root")) parser.add_argument("--database", default="customer_behavior") parser.add_argument("--table", default="customer_shopping_behavior") args = parser.parse_args() df = prepare(load_data(args.csv)) print(f"Prepared {len(df)} rows and {df.shape[1]} columns.") print(f"Missing values left: {int(df.isnull().sum().sum())}") if args.skip_db: df.to_csv(args.out, index=False) print(f"Saved {args.out}") else: load_to_mysql(df, args.host, args.port, args.user, args.database, args.table) if __name__ == "__main__": main()SQL Analysis
Using MySQL Workbench, I wrote queries to answer ten business questions about customer segments, loyalty and purchase drivers. Each result is shown below its question.
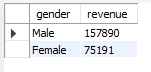
Revenue by Gender
What is the total revenue generated by male vs. female customers?
High-Spending Discount Users
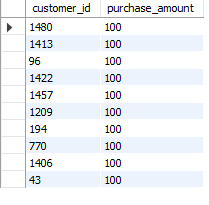
Which customers use a discount but still spend more than the average purchase amount?
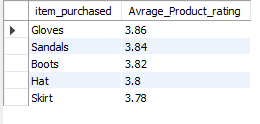
Average Review Rating
Which are the top 5 products with the highest average review rating?
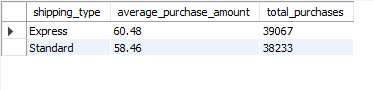
Shipping Type Comparison
How does the average purchase amount compare between standard and express shipping?
Spending vs. Subscription Status
Do subscribed customers spend more? Compare average spend and total revenue.

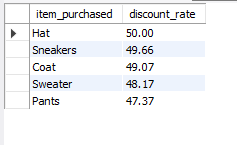
Discounted Purchases
Which 5 products have the highest percentage of purchases with a discount applied?
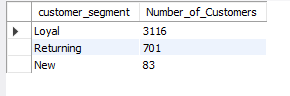
Customer Segments
How many customers are New, Returning and Loyal, based on previous purchases?
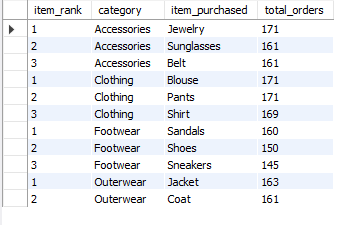
Top 3 Products per Category
What are the top 3 most purchased products within each category?
Repeat Buyers & Subscriptions
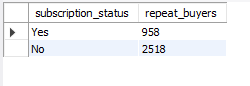
Are repeat buyers (more than 5 previous purchases) also likely to subscribe?
Revenue by Age Group
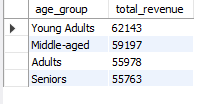
What is the revenue distribution across each age group?
The Interactive Dashboard
The Power BI dashboard is fully interactive, so anyone can explore the data themselves instead of reading a fixed report.
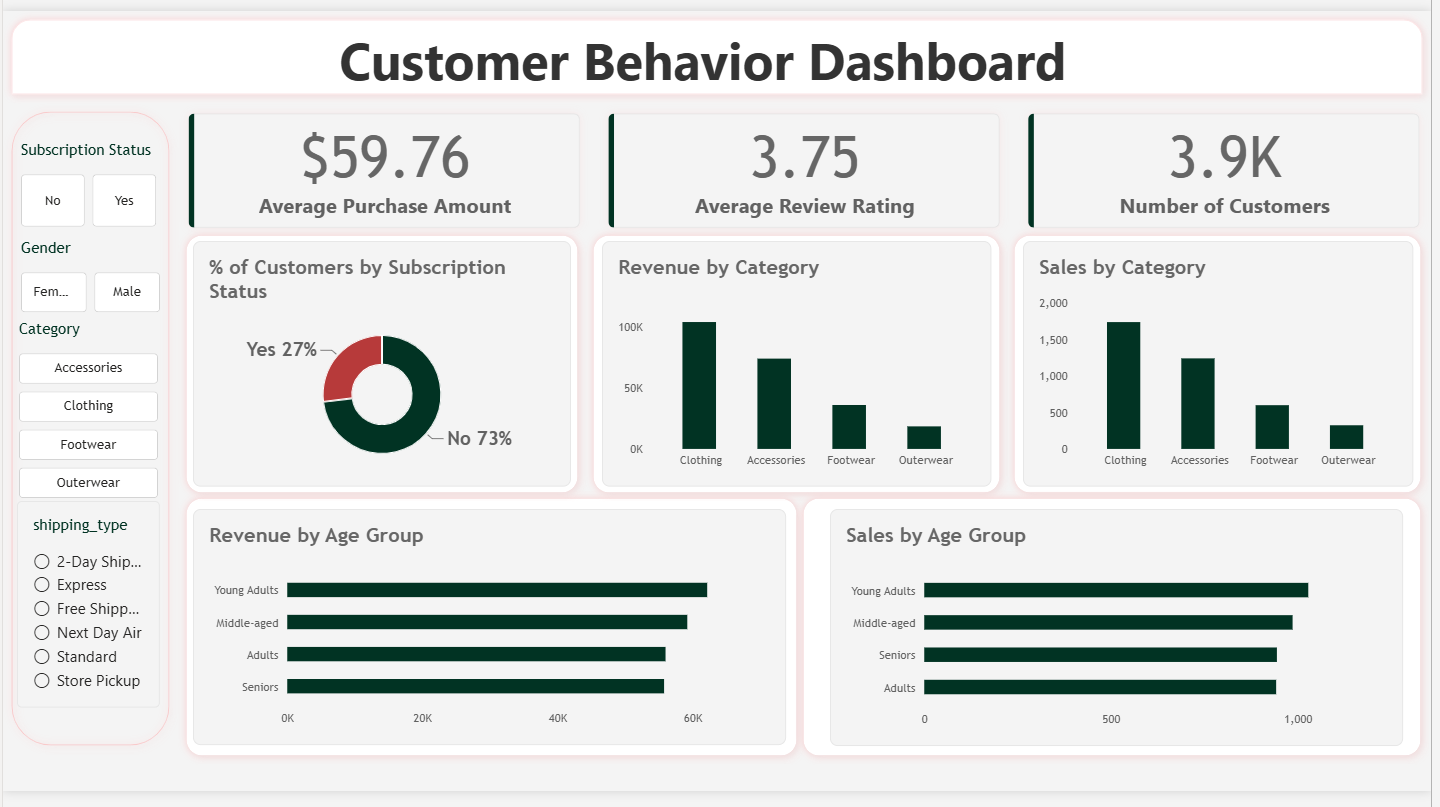
- Use the slicers on the left: filter by subscription status, gender, category and shipping type.
- Click any chart: select a bar or slice to highlight that segment across the dashboard.
- Get instant answers: averages, ratings and customer counts update as you explore.
What the Data Showed
| Question | Result |
|---|---|
| Revenue: male vs. female customers | $157,890 vs. $75,191, so male customers generated about twice the revenue |
| Average spend: subscribers vs. non-subscribers | $59.49 vs. $59.87, and only 1,053 of 3,900 customers (27%) subscribe |
| Average purchase: Express vs. Standard shipping | $60.48 vs. $58.46 |
| Customer segments | 3,116 Loyal, 701 Returning and 83 New customers |
| Top revenue age group | Young Adults ($62,143), with the other three groups close behind |
| Repeat buyers who subscribe | 958 of 3,476 (about 28%), close to the overall 27% |
Recommendations
- Boost subscriptions: promote exclusive benefits for subscribers to encourage more sign-ups.
- Customer loyalty programs: reward repeat buyers to help move them into the Loyal segment.
- Review the discount policy: balance the sales boost from discounts with healthy margin control.
- Product positioning: feature top-rated products prominently in marketing campaigns.
- Targeted marketing: focus on high-revenue age groups and express-shipping customers.
- Gender-focused strategy: target male buyers, who bring in more revenue, or offer rewards to engage more female customers.